If you are doing probabilistic programming you are dealing with all kinds of different distributions. That means choosing an ensemble of right distributions which describe the underlying real-world process in a suitable way but also choosing the right parameters for prior distributions. At that point I often start visualizing the distributions with the help of Jupyter notebooks, matplotlib and SciPy to get a feeling how the distribution behaves when changing its parameters. And please don’t tell me you are able to visualize all the distributions scipy.stats has to offer just in your head.
For me, this surely is a repetitive task that every good and lazy programmer tries
to avoid. Additionally, I was never quite satisfied with the interactivity of
matplotlib in a notebook. Granted, the %matplotlib notebook magic was a huge
step into the right direction but there is still much room for improvement.
The new and shiny kid on the block is Bokeh and so far I have not really done
much with it, meaning it is a good candidate for a test ride. The same goes
actually for Jupyter’s ipywidgets and you see where this going. No evaluation
of a tool without a proper goal and that is now set to developing an interactive
visualization widget for Jupyter based on Bokeh and ipywidgets. So here we go!
It turned out that this task is easier than expected due the good documentation and examples of ipywidgets and especially Bokeh. You can read all about the implementation inside this notebook which is hosted in a separate Github repository. This also always me to make use of a new service that I just recently learned about, binder. This totally rad service takes any Github repository with a Jupyter notebook in it, fires up a container with Kubernetes, installs necessary requirements and finally runs your notebook! By just clicking on a link! Amazing to see how the ecosystem around Jupyter develops these days.
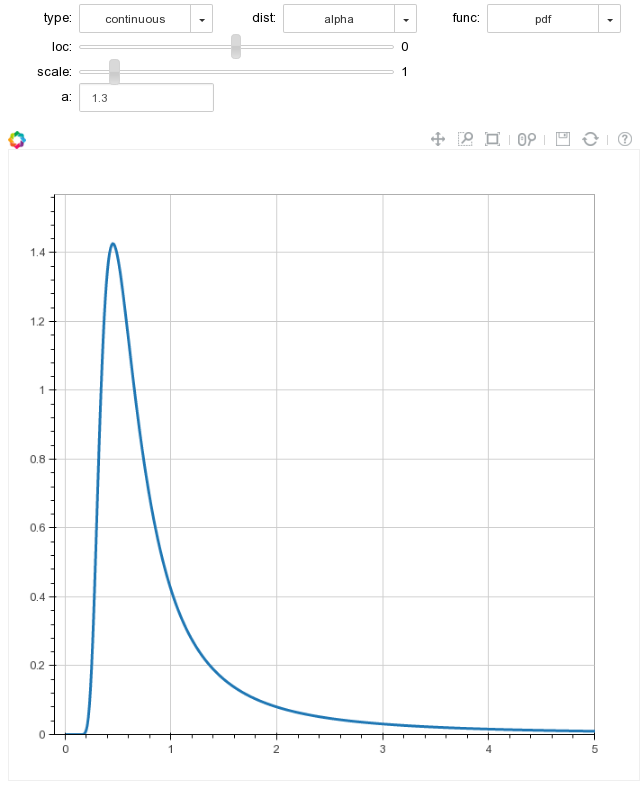
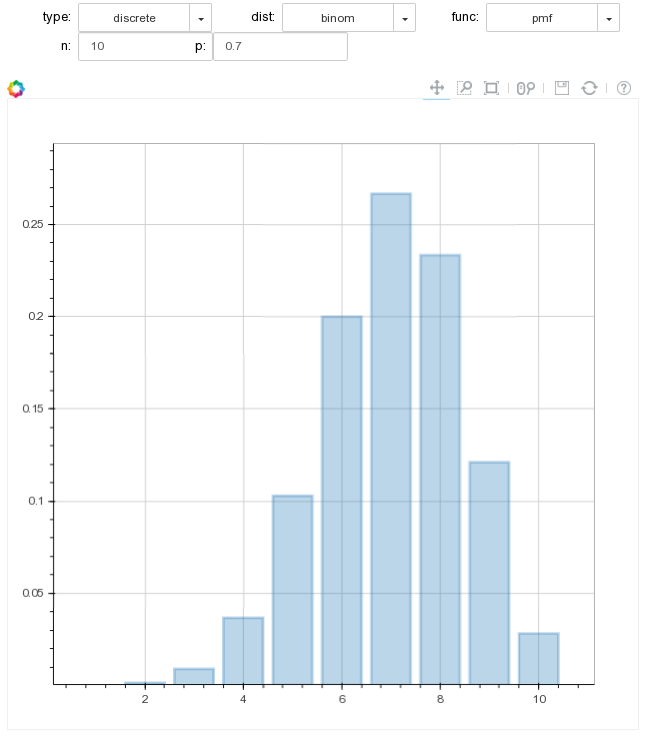
And of course to wet your appetite, here are the screenshots of the final tool that you will experience interactively by starting the notebook with binder.
Comments
comments powered by Disqus